
Post contributed by Abhinav Jindal, Department of Astronomy, Cornell University, USA.
The European Space Agency’s Rosetta mission to 67P/Churyumov–Gerasimenko (67P) provided the most detailed ever views of a comet’s surface. By tracking the comet on its journey through the inner solar system for just over two years, Rosetta observed an increasing amount of activity and surface changes as the ice-rich surface warmed up. These observations revealed that 67P had seasons. Specifically, due to its present-day obliquity and orbit, southern summer corresponds closely with perihelion. This results in orders of magnitude greater insolation at southern latitudes than in the north [Hu et al., 2017]. Accordingly, a greater number of particles are eroded and launched from southern latitudes, with a large fraction falling back onto the surface in the cold northern hemisphere [Thomas et al., 2015; Keller et al., 2017]. This creates a hemispheric dichotomy in surface morphologies – layered bedrock units that represent the exposed nucleus are dominant in the south (“rough” terrains), while topographically smooth, sediment-covered regions dominate the north (“smooth” terrains) [Birch et al., 2017]. It was within the smooth terrains that we observed the majority of changes on 67P [Groussin et al., 2015; El-Maarry et al., 2017; Hu et al., 2017; Pajola et al., 2017a; Birch et al., 2019], making them critical to understanding the overall evolution of the comet. Our work [Jindal et al., 2022] tracked some of the most dramatic large-scale changes within these sedimentary deposits (Image 1). Specifically, in the largest and most southern smooth terrain deposit – termed Imhotep – we observed dozens of pits, bounded by multi-meter high scarps, grow and migrate across the region for many months.

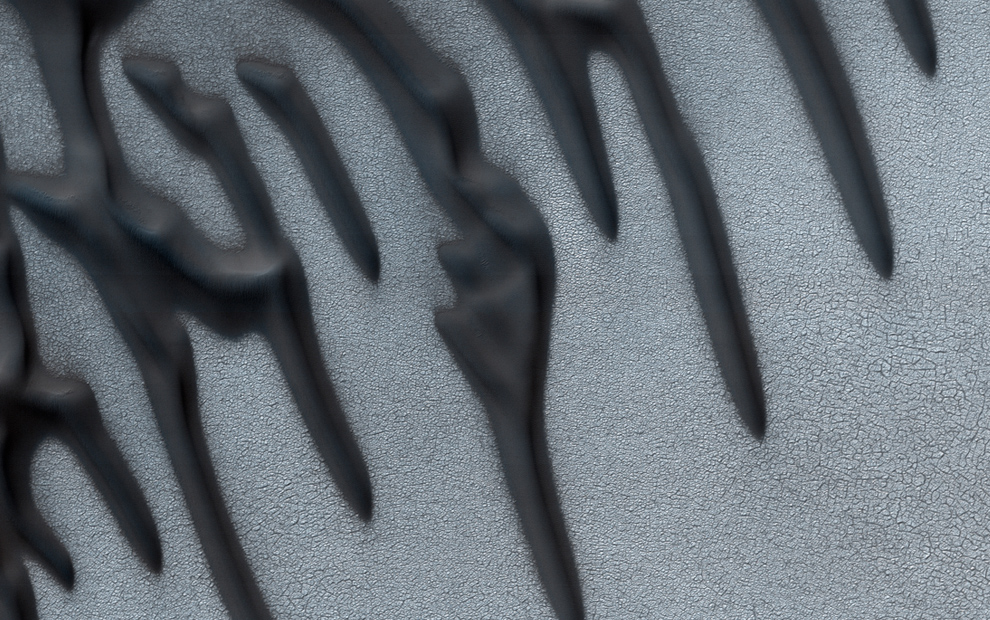
Image 1: Activity in Imhotep. Animation showing georeferenced images of the Imhotep region from 05/24/2015 – 01/23/2016. Activity in the region persists from 06/05/2015 – 12/06/2015 and can be seen in the form of scarps (arcuate depressions) migrating through the region. Images were downloaded and are freely available on ESA’s Planetary Science Archive (https://archives.esac.esa.int/psa) and NASA’s Planetary Science Data System (https://pds.nasa.gov), and were georeferenced using the shapeViewer software (www.comet-toolbox.com).
(more…)
